Tạo tài khoản Pombeebee để đăng câu hỏi và được giáo viên hướng dẫn.

Lee Wenyong
9/7/2024


3

26
Lee Wenyong
9/7/2024
CÂU LẠC BỘ TIẾNG ANH VÀ KỸ NĂNG MỀM POMBEEBEE CHO NGƯỜI ĐI LÀM – HOÀN TOÀN MIỄN PHÍ!
Bạn là sinh viên sắp tốt nghiệp mong muốn cải thiện tiếng Anh và chuẩn bị tốt nhất cho quá trình ứng tuyển việc làm (viết CV, phỏng vấn, v.v)? Bạn là người đi làm muốn rèn luyện tiếng Anh giao tiếp, thuyết trình và các kỹ năng mềm để tự tin và có cơ hội thăng tiến trong công việc? Bạn không có kinh phí tham gia các lớp học thêm đắt đỏ? Bạn cảm thấy khó khăn để sắp xếp thời gian tham dự các câu lạc bộ tiếng anh offline? Hãy đến với câu lạc bộ Tiếng Anh và kỹ năng mềm của Pombeebee. Tại đây bạn KHÔNG MẤT BẤT KÌ CHI PHÍ NÀO và sẽ được: 1. Tự tin luyện nói tiếng Anh với giáo viên bản xứ mọi lúc, mọi nơi thông qua tính năng voice record, giúp bạn chủ động thời gian. Nếu ngại gửi voice record vào group chat, bạn có thể gửi riêng cho giáo viên để được lắng nghe, nhận xét và góp ý cải thiện, không giới hạn số lần gửi. 2. Hỗ trợ tư vấn, đưa ra lời khuyên để cải thiện các kỹ năng mềm cần thiết cho học tập và công việc như: cách viết CV tốt, viết internship/scholarship letter, chuẩn bị cho interview, cách viết email chuyên nghiệp, thuyết trình, v.v 3. Giáo viên phụ trách là Mr. Lee Wenyong: Tốt nghiệp Đại học Công nghệ Nanyang của Singapore với bằng Danh dự về Kỹ thuật Đạt điểm cao nhất môn Tiếng Anh trong Chứng chỉ Giáo dục Tổng quát Singapore –Cambridge Doanh nhân người Singapore, người sáng lập Lee Wenyong & Co. Holdings, cung cấp dịch vụ nhân sự và kế toán cho BreadTalk, Burberry, Bvlgari, Christian Dior, Elizabeth Arden, Hermes, Prada, Salvatore Ferragamo, Tiffany & Co. và National Trades Union Congress (NTUC) Hơn 12 năm kinh nghiệm giảng dạy cho hơn 500 chủ doanh nghiệp Singapore cách sử dụng hiệu quả các công cụ kinh doanh thông minh và phân tích dữ liệu để tối đa hóa doanh thu, tối ưu hóa nhân lực và duy trì dòng tiền 4. Chủ đề của câu lạc bộ bao gồm nhưng không giới hạn các ngành nghề như: Marketing, Digital marketing, Customer service, Customer Experience, Public relations, Web design, Web development, E-Commerce development, Graphic design, Mobile development, Audio production, Animation, Illustration, Translation, Photography, 3D modeling, Game design, Product design. Nếu bạn có thắc mắc thêm về English club, hãy comment ngay bên dưới để Pombeebee giải đáp bạn nhé! Hãy tham gia ngay: Nhấn vào nút "Gia nhập" để tham gia câu lạc bộ hoàn toàn miễn phí! Bạn là sinh viên sắp tốt nghiệp mong muốn cải thiện tiếng Anh và chuẩn bị tốt nhất cho quá trình ứng tuyển việc làm (viết CV, phỏng vấn, v.v)? Bạn là người đi làm muốn rèn luyện tiếng Anh giao tiếp... Xem thêm


3
2
bùi quỳnh chi
29/9/2025
em mong đc các thầy cô chấm chữa bài ạ
Some individuals suggest that participating in the arts as a recreational activity in free time should be done by all adults, while some arguments. Although both views hold merit, I agree more with the latter. There are many reasons why all adults should join in this activcities. One of them is that it can relieve stress since professional and educational obligations have become a burden given by the development of our society. Nowadays, adults are living in a stressful lifestyle, many of them fail to spend enough time interacting with others socially, which leads to isolation that can damage their mental health. As a result, by taking part in the arts, such as singing, dancing or drawing, it allows them to communicate with others, building not only a meaningful relationship but also become more sociable. On the other hand, engaging in the arts, especially in the field of music, it requires a lot of financial resources, which cannot be afforded by all adults or even by the government. Also, interest is a highly personal topic, meaning that each individual would haver a different prefenrence, and arts are not always the choice of all people. For these individuals, as long as a recreational activity provides chances for social interactions and relaxation, they can make the ultimate choice by themselves. In conclusion, while some argue that all adults should take part in the arts due to improving overall well-being and fostering social relationship, my view is that it should be seen a personal choice for each individual. Some individuals suggest that participating in the arts as a recreational activity in free time should be done by all adults, while some arguments. Although both views hold merit, I agree more with th... Xem thêm
0
0
Phạm Bảo Vân
26/8/2025
Học viên chu đáo
Mong cô chấm writing task 1 giúp e ạ. E cảm ơn
The graph below shows the average house prices in 3 countries between the years 1997-2014. Summarize the information by selecting and reporting the main features, and make comparisons where relevant. ANSWER: The line chart illustrates the average house costs in three countries over the course of 17 years, commencing from 1997. Overall, the average house prices in all three countries experienced an upward trend during the period. Another key feature is that Country A consistently had the highest price, while the reverse was true for Country C. The price fluctuations were also more pronounced in countries A and B than in Country C. In 1997, the average house costs in Country A was approximately $150k, then it rose steadily to $250k in 2001 before surging to over $500k. However, it experienced a slight dip to about $470k in 2006. After that, it increased again to $600k in the final year examined. Similarly, Country B started at a lower figure of around $125k, following a similar upward trajectory to Country A. Its price peaked at over $500k in 2005 before registering a slight fall, but it eventually returned to initial level by 2010 and remained stable at around $500k until 2014. By contrast, Country C had the lowest average house price of three countries throughout the period. Beginning at $100k, its price rose gradually to almost $250k in 2006 before experiencing a slight decrease in two years. Finally, it gradually rose to over $250k in 2014. The graph below shows the average house prices in 3 countries between the years 1997-2014. Summarize the information by selecting and reporting the main features, and make comparisons where relevant.... Xem thêm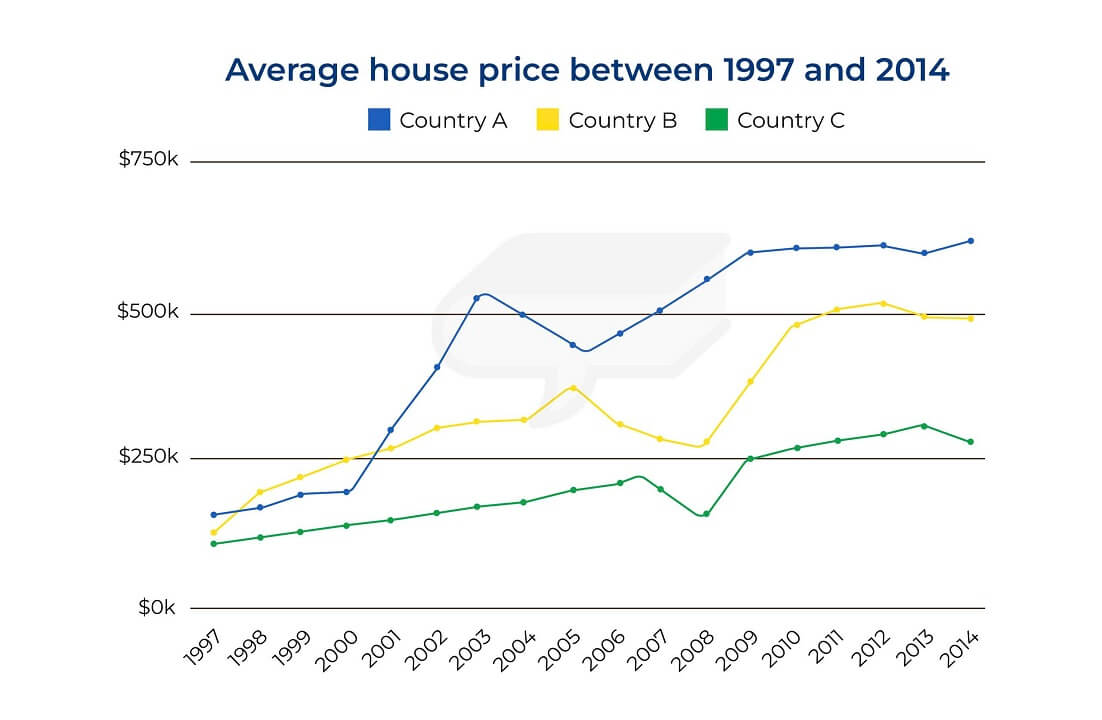
1
0
Nguyen Hong Phuc
2/8/2025
mong thầy cô giúp với ạ
Some people say that the best way to improve public health is by increasing the number of sports facilities. Others, however, say that this would have little effect on public health and that other measures are required. Discuss both these views and give your own opinion. Opinions are divided on whether increasing the number of sports facilities is the optimal solution to improve public health. Both contrasting viewpoints will be analyzed in this essay, which also argues that combining exercise in organizations and a nationwide healthy dietary policy would be a better solution. Admittedly, proponents of the addition of more sports clubs often emphasize the substantial effect of exercise on overall wellness. Providing more sports amenities, such as fitness centers or yoga classes, can improve access to physical activities in communities, leading to improved public health. However, this perspective overlooks the fact that in today’s increasingly hectic life, people often find it challenging to make time for physical exercise. Many Americans and Canadians do not frequent the gym despite holding annual memberships, meaning that adding more sports amenities may have an insignificant effect on public health. It is also noteworthy that improving health is largely related to healthy diets, so this aim is unlikely to be achieved by increasing the number of sports facilities. In light of the aforementioned limitations, I am convinced that the following measure would be more effective in achieving the aim. Firstly, governments should encourage organizations like schools and companies to allocate part of working hours for physical activities. This might be the key to enabling students and employees to gain more access to physical activities, resulting in improved health. This solution should be executed in tandem with the implementation of a nationwide healthy diet policy. For example, requiring food suppliers to provide organic produce and high-quality meat and fish to consumers, thereby enhancing public health. In conclusion, I believe that increasing the number of sports centers may fall short as an effective method to improve public health. A more comprehensive approach to enhancing public health would involve immensely encouraging physical activities in organizations and promoting a healthy eating policy. Some people say that the best way to improve public health is by increasing the number of sports facilities. Others, however, say that this would have little effect on public health and that other mea... Xem thêm
0
0
Ngô Uyển Nhi
1/7/2025
mong thầy cô chấm hộ em bài này với ạ
Some people think traditional games are better than modern games in helping children develop their abilities. To what extent do you agree ? Essay Some people hold the belief that conventional games overshadow modern games in terms of how beneficial they are to children's development. This essay strongly agrees with the statement as now will be discussed. On the one hand, some people have a positive view of modern games due to its effective impacts on children’s cognitive abilities. Simulation games, for example, offer children the opportunities to design their own virtual world, which fosters their creativity. There are also other strategy games that require students to thick quickly so as to compete against opponents or overcome challenges, thereby enabling the growth of problem solving. However, the benefits can come at a steep cost. The immersive and addictive nature of modern games can lead to excessive exposure to screen time, fostering sedentary lifestyles and health issues such as obesity and poor posture. Moreover exposure to screen time in a long time can lead to mental fatigue, reduced attention span and even social isolation, highlighting the significant drawbacks of relying on modern games for development. On the other hand, conventional games help children experience a more well - rounded development. In terms of physical well-being, many games such as hide-and-seek or tag, involve outdoor physical activities, promoting physical fitness and coordination. Games like these also encourage teamwork, communication and leadership, as children can interact with their peers in a collaborative environment. As far as cognitive ability is concerned, mentally stimulating traditional games such as chess, puzzles and building blocks can enhance concentration, logical-thinking and creativity in an engaging way. Unlike modern games, traditional games rarely lead to addiction , offering a healthier and more sustainable means of growth. In conclusion, while modern games have their merits in stimulating specific cognitive abilities, their addictive nature and associated drawbacks often overshadow their benefits. In contrast, traditional games provide a well-rounded development, nurturing physical health, social interaction, and creativity. Some people think traditional games are better than modern games in helping children develop their abilities. To what extent do you agree ? Essay Some people hold the belief that conventional game... Xem thêm
0
0
Chu Tâm Như
27/6/2025
Mong thầy cô chấm giúp em writing task 1 ạ . em cảm ơn
The given pie charts provide information regarding Australia’s energy sources in 2008 along with its predicted figures for 2030. Overall ,while oil continues to account for one third of the overall statistics in this nation both in 2008 and 2030 , gas and coal witnessed contrasting patterns in 2030. Other less popular energy sources remain relatively the same throughout 22 years , except for the introduction of geothermal energy in 2030. Regarding 3 energy sources that constrituted the majority of the charts, coal emerged as the dominant resource in 2008 , standing at 39.00%. However , in 2030, it is predicted to shrink to 22.30%, losing its first rank to oil. Oil, on the other hand, started at a rate of 32.50% in 2008 before being forecasted to gain ground at 35,5% in 2030, replacing oil as the most well-known energy source. Gas is the only sector that witnesses a substantial increase, rising from 22.90% to a prediction of 32.00% after 22 years , standing at the second leading energy source in 2030. In respect of other types of energy with low figures, there is hardly any noticeable change in the period. Commencing with wind and hydro power , the usage percentage for these two slightly increased from 0,3% to 0,9% and 0,2% to 0,7% , displaying barely any remarkable growth. Other energy sources consistently stand at 4.30% from 2008 to the prediction point in 2030, constituting a small proportion of the two graphs. The advent of geothermal power is welcomed in 2030, culminating at the same figures of other energy sources of 4.30%. The given pie charts provide information regarding Australia’s energy sources in 2008 along with its predicted figures for 2030. Overall ,while oil continues to account for one third of the overall... Xem thêm
0
0
Khánh Nguyên
13/6/2025
Thầy cô chấm giúp em writing task 2 ạ, em cảm ơn nhiều.
In recent years, the trend of individuals seeking the historical background of their building or house has increased in many nations. In this essay, I will explore the reasons for this phenomenon and also suggest some ways people can carry out this research. One of the primary reasons for this interest is the rising awareness of cultural significance among citizens. This growing desire to preserve heritage makes them more curious about the history of their houses to have the ability to feel the connection to the previous generation and also the sense of belonging to the community, linking individuals to the intriguing stories and traditions of the past. Take youngsters as an example, those who learn about the historical significance of their homes may gain a deeper appreciation for the struggles and achievements of their ancestors, which in turn can encourage them to maintain the tradition and heritage. Furthermore, the deep understanding of the historical background enables dwellers to know the historical or architectural value that can increase long-term historic properties. For instance, Hanoi Old Quarter has many ancient houses built about 100 years ago that are now still the testimonies of the way of life in the 1900s attracting many real estate investors. Many methods can be employed to research the history of their homes. One suggestion is to look at the public records such as census data, land registers or local history books. Those resources, available both online and offline, contain a wealth of information throughout the history for tracing the origin of the building. Additionally, engaging with previous occupants and neighbours can help to gain more insights as they may know the stories or events that are not written down such as renovations after any collapses from disasters. In conclusion, the rising interest in historical curiosity of homes and buildings is mainly driven by the desire to protect cultural heritage and seek out historical value in their houses. By searching in public records and interviewing their neighbours, the recent householders can gain more essential information about historical knowledge of their places. In recent years, the trend of individuals seeking the historical background of their building or house has increased in many nations. In this essay, I will explore the reasons for this phenomenon and... Xem thêm
0
0
Bảo
12/6/2025
Mong thầy cô chấm giúp em Writing Task 1 với ạ, em cảm ơn thầy cô nhiều
Đề bài: The graph shows the number of boys and girls playing sport in an English town in 2012. Bài làm: The given bar chart illustrates how many males and females participate in 6 different kinds of sports in an English town in 2012 Overall, it is notable that the number of Hockey participants was the lowest in both genders compared to other sports. Another striking observation is that male players exceeded females in most sports, with exception for badminton and swimming during the given period. In 2012, football saw the most significant difference between the sexes, specifically, the number of male players, at 60, was three times higher than the figure for females. Regarding cycling and hockey, boys participated with approximately 38 and 16, nearly double that of girls with 20 and around 9, respectively. In addition, in terms of tennis, that 50 boys took part in this sport was about 12 higher than the figure for girls, at nearly 38. By contrast, there were more girls playing badminton and swimming than boys. To be specific, with regard to badminton, 40 females participated in this sport which was 10 higher than the figure for males at 30. With the same trend, swimming was the most popular sport for females with 50 participants, compared to nearly 41 male counterparts. Đề bài: The graph shows the number of boys and girls playing sport in an English town in 2012. Bài làm: The given bar chart illustrates how many males and females participate in 6 different kinds of... Xem thêm
0
0
Bảo
12/6/2025
Mong thầy cô chấm giúp em Writing Task 1 với ạ, em cảm ơn thầy cô nhiều
Đề bài: The chart below shows the expenditure of two countries on consumer goods in 2010 Bài làm: The given bar chart illustrates how much money spent on 5 types of products by two different nations, namely France and Britain in 2010 Overall, it is notable that cars were the most popular item in both countries compared to the others. Another striking thing is that the expenditure in Britain was higher than France’s in most of the categories, except for Computers and Perfume. In 2010, in terms of cars, The British spent 450,000 pounds, which was higher than the French, at 400,000 pounds . Similarly, the expenditure on books of the British consumers was higher with 400,000 pounds, whereas the significant lower was seen in the French with 300,000. By contrast, regarding computers, around 350,000 pounds was spent on this category by the British, which was 30,000 pounds lower than the figure of France. In addition, spending on perfume was the lowest in both countries, to be specific, the French citizens spent 200,000 pounds compared to approximately 140,000 pounds in the UK. Moreover, with regard to cameras, the figure for Britain was double, at 350,000 pounds, in comparison with only 150,000 pounds in France. Đề bài: The chart below shows the expenditure of two countries on consumer goods in 2010 Bài làm: The given bar chart illustrates how much money spent on 5 types of products by two different natio... Xem thêm
0
0
Khánh Nguyên
10/6/2025
Thầy cô chấm giúp em writing task 1 ạ, em cảm ơn nhiều.
The first graph displays the percentage of households in a country that owned electrical appliances between 1920 to 2019, while the second one shows how much time the average household in that country spent doing housework in the same period. Overall, the ownership of electrical appliances all increased during this period, with that of refrigerators having the greatest rise. At the same time, the number of hours spent doing the household chores experienced a decrease. Specifically, washing machines were the most common electrical appliance among the three, with 40% using it in 1920. The ownership saw a continuous increase to about 75% in 2019, with a small dip in 1980. Moreover, the proportion of households using vacuum cleaners increased steadily but did not reach 100% until 2000. In comparison, almost no household used a refrigerator in 1920; however, the ownership rose significantly, and by 1980, 100% household used it and it became the essential one in every house. The number of hours spent doing housework, in contrast, fell considerably from 50 to 15 hours per week between 1920 and 1980. Afterward, it dropped slightly to about 10 hours a week in the year 2019. The first graph displays the percentage of households in a country that owned electrical appliances between 1920 to 2019, while the second one shows how much time the average household in that country... Xem thêm

0
4
Ngân
10/6/2025
Mong cô chấm writing task 1 giúp em ạ. Em xin cảm ơn cô nhiều ạ!
The chart below compares the number of people per household by percentage in the UK in 1981 and 2001. Summarise the information by selecting and reporting the main features, and make comparisons where relevant. Essay: The chart illustrates the number of people per household of different sizes by percentage in the UK in 1981 and 2001. Overall, there had been an upward trend towards smaller houses over two decades, while households of larger sizes underwent a noticeable decrease. Additionally, the most common living arrangement comprised 2 people in both years. Starting with smaller homes in 1981, single-person households accounted for 17% of the share, which was half that of those with 2 people, at 31%. Meanwhile, the figures for homes with 3 and 4 occupants were 20% and 18%, respectively, followed by the proportion for 5-person and 6-person households at 8% and 6%. By 2001, the figures for smaller households both experienced a significant rise to become the leading housing option, making up a quarter and a third of all homes in the same year. In contrast, those with 3 individuals saw a slight drop to 17%, followed by a figure of 15% for those with 4 people. Likewise, homes of larger sizes accounted for the smallest share, with a fall in their proportion to only 6% for 5-person and 2% for 6-person households, remaining the least chosen ones. The chart below compares the number of people per household by percentage in the UK in 1981 and 2001. Summarise the information by selecting and reporting the main features, and make comparisons wh... Xem thêm
0
1
Ngân
8/6/2025
Mong cô chấm writing task 1 giúp em ạ. Em xin cảm ơn cô nhiều ạ!
The chart presents data on the number of school trips made by different means of transport by children aged 5 to 12 in a particular country in 1990 and 2020. Overall, car usage was the least common method, while walking was widely chosen by the schoolchildren in 1990. However, there was a major shift later in the transport references, as the number of car trips surpassed trips made on foot to reach its leading position after 30 years. A closer look at the chart reveals that in the first year, travelling to school by car generated the least number of trips, with a figure of 4 million, while walking was used most widely, with over 12 million trips. Subsequently, the number of car journeys experienced a significant rise to 11 million in 2020, making the car the most common method for travelling to school. In contrast, the number of students walking to school saw a considerable decrease, which caused the number of trips to recede by half to 6 million in the same year. As for bus usage, the number of trips dropped slightly from 7 to 5 million, showing its stable position within 30 years, as the second and third common modes of transport for schoolchildren in 1990 and 2020, respectively. Meanwhile, the figures of school journeys made by bicycles and the combination of walking and bus were similar at 6 million in 1990, before falling to 2 and 3 million, which makes them the least used method for travelling to school in 2020. The chart presents data on the number of school trips made by different means of transport by children aged 5 to 12 in a particular country in 1990 and 2020. Overall, car usage was the least common... Xem thêm
0
5
Nguyen Hong Phuc
7/6/2025
mong thầy cô giúp với ạ
The diagrams illustrate the primary factors that made global agricultural land less productive and the level of effects of these reasons on three different regions during the 1990s. Overall, the cattle’s overconsumption of grass was witnessed as the main culprit of land degradation on a global scale. Additionally, among the examined areas, Europe experienced the highest level of degradation. Regarding the causes, the act of over-grazing was the most significant contributor to the land deterioration, with 35% recorded. To a lesser extent, the excessive removal of trees and over-cultivation exhibited similar figures, with 30% and 28%, respectively while merely 7% came from unspecified reasons. Concerning the levels of impact, the European region experienced the most degradation of land when 23% of agricultural land became less productive, with 9.8%, 7.7%, and 5.5% for deforestation, over-cultivation, and over-grazing, respectively. Less significantly, 13% of the land degraded was seen in Oceania, 11.3% of which came from over-grazing while removing tree made up only 1.7%. The least affected area was North America, whose total land degraded was recorded at only 5%, with excessive focus on farm work and cattle-feeding making up 3.3% and 1.5% in that order, while the remaining reason had merely 0.2%. The diagrams illustrate the primary factors that made global agricultural land less productive and the level of effects of these reasons on three different regions during the 1990s. Overall, the catt... Xem thêm
0
4
Khánh Nguyên
6/6/2025
Mong thầy cô chấm giúp em bài Writing task 2 này ạ, em cảm ơn nhiều.
In many societies, many youngsters are often encouraged to believe that they will attain any goals if they try their best. While this action has strong advantages promoting confidence among children, there are some more potential drawbacks about mental health issues that we need to consider. On the one hand, instilling a growth mindset at a young age leads to self-esteem and confidence that will significantly impact future success. When children are taught about the benefits of working hard, they know how to set objectives and have strong belief in themselves to achieve something. Another merit is fostering resilience and staying strong during hardship. This positive thinking will inspire ambition and motivation if the young children need to face any challenges in their life. Research shows that children who believe in their abilities will have more chances to gain achievements than those who have negative feelings about themselves. On the other hand, delivering the message that everything is achievable can set unrealistic expectations among young individuals. This will lead to the disillusionment that can affect their performance at studying and working in the long term. Another downside is that the disappointment if the goals cannot be met may result in many problems about mental health issues such as anxiety, depression, or even having suicidal thoughts. For example, children who were put beyond their limits for a long time may get the risk of burnout or emotional exhaustion after having any failures. In conclusion, it is important to know that while inspiring children’s motivation is a good teaching method, this message at the same time can impact their mental health significantly. Therefore, we need to balance between encouraging and understanding those youngsters' abilities for better education. In many societies, many youngsters are often encouraged to believe that they will attain any goals if they try their best. While this action has strong advantages promoting confidence among children,... Xem thêm
0
3
Khánh Nguyên
5/6/2025
Mong thầy cô chấm giúp em bài Writing task 1 này ạ, em cảm ơn nhiều.
The chart illustrates what one’s university Anthropology degree holders took up for a job after completing their undergraduate course while the table shows the salary brackets of Anthropology graduates after five years. Overall, the majority of the alumni found full-time jobs. In addition, a significant proportion of freelance consultants and government sectors earned at least 75,000$ for their living while only a half of employees working in private companies reached this income level. To begin with, over half of graduates worked full-time with the figure of 52% compared to 15% of which did part time jobs and 12% unemployed. Whereas, the postgraduate students and postgraduates with part time jobs only made up 16% in total. Moving on to the income group, 80% of the freelance consultants earned at least 75,000$ for their compensation and half of which gained 100,000$. Although there was also the proportion of 80% employees from government sector received salary of 75,000$, 50% of them earned 100,000$ as their salary. In contrast, only 55% of graduates working for private companies made a minimum of 75,000$. The freelance consultants and government workers receiving 25,000$ - 49,000$ only stood at 5% while the figure for private companies workers was 10%. The chart illustrates what one’s university Anthropology degree holders took up for a job after completing their undergraduate course while the table shows the salary brackets of Anthropology graduate... Xem thêm
0
4
Nguyen Hong Phuc
21/5/2025
mong thầy cô giúp với ạ.
The diagrams illustrate the transformation of the ground floor of a particular building since 1958. Overall, this area has undergone relatively extensive rearrangements and modifications, with this space being converted into an apartment and a flower shop, while the entrance and the kitchen have remained intact. From 1985 to 2000, the office was repurposed into an apartment. Specifically, on the left side of the entrance, the secretary’s office and the toilet were merged into one to make way for creating a new bathroom and shower, accompanied by the demolition of the nearby office catering to assistants. Additionally, during this time, there was a slight expansion of the meeting room at the back-right corner to pave the way for constructing a living room. Regarding the opposite side of the entrance, the reception area and the manager’s office were removed, followed by the addition of two new bedrooms. Concerning the period from 2001 to present when the apartment has been converted into a flower shop, on the left section of the entrance, a playground, a large flower, and a spot for gift cards at the far side have been added. These changes have led to the removal of all the rooms. Looking at right side, another flower area and an office room have replaced the two bedrooms. Notably, despite the significant changes, the entrance and the kitchen have been preserved throughout. The diagrams illustrate the transformation of the ground floor of a particular building since 1958. Overall, this area has undergone relatively extensive rearrangements and modifications, with this s... Xem thêm
0
4
Lora
17/5/2025
you are going to write an opinion essay in respond to the following. Your essay should be 250 words long: " There are more challenges and risks than benefits to new technology"
The debate over whether new technology brings more harm than good is complicated. While it’s true that tech like AI, robots, and social media can cause problems, I believe the benefits are greater as long as we use these tools carefully and fix issues as they arise. First, technology has already improved lives in countless ways. For example, medical advancements, such as AI tools that detect cancer early, save lives daily. In the next decade, renewable energy tech like better solar panels will have reduced air pollution in cities, making communities healthier. Similarly, online learning platforms will have given millions of students worldwide access to quality education, closing gaps between rich and poor. These changes show tech’s power to solve big problems. However, risks like job loss from automation or privacy leaks are serious. Many worry robots will replace factory workers, leaving families struggling. But this doesn’t mean we should stop progress. By the time automation becomes common, governments will have introduced programs to train people for new jobs, like maintaining AI systems or designing green tech. Companies will have also improved data security, making hacking far less likely. The key is to act early, not fear innovation. Critics argue tech moves too fast for rules to keep up. Yet history shows we adapt. Phones distracted us, but now apps help us focus. Social media caused isolation, but it also connects people globally during crises. In conclusion, technology’s risks are real but manageable. With smart laws, education, and ethical choices, its benefits in healthier lives, cleaner energy, equal opportunities all of which can outweigh the downsides. The debate over whether new technology brings more harm than good is complicated. While it’s true that tech like AI, robots, and social media can cause problems, I believe the benefits are greater as... Xem thêm
0
3
Ngân
11/5/2025
Mong cô chấm writing task 2 giúp em ạ. Em xin cảm ơn cô nhiều ạ!
Directors of large organizations earn much higher salaries than ordinary employees do. Some people think it is necessary, but others are of the opinion that it is unfair. Discuss both views and give your own opinions. Answer: Opinions are divided on whether large organizations should offer directors higher compensation packages than ordinary workers. While both views hold merits, I believe that it is entirely essential to pay individuals in top positions higher salaries, for reasons related to their responsibilities and economic values. On the one hand, some people argue that the directors of large companies should not earn better **salaries,** as it might lead to inequality and negative attitudes in the workforce. Proponents of this opinion say that members of organizations have the same level of commitment to working time, so comparable salaries are necessary to ensure equality in treatment. For example, officers of large organizations strictly follow the 9-to-5 regulation, which means to start work at 9 in the morning and leave work at 5 in the afternoon, resulting in a demand for fair remuneration policies. Additionally, there are frequent cases when junior members are required to complete trivial tasks without additional payment, which are beyond their work scope. As a result, better compensation packages for managerial positions might cause the feeling of envy among subordinates, dramatically affecting the attitudes and morale in the workforce. On the other hand, I think that excessive salaries for directors are necessary in terms of the higher responsibilities and greater value that they commit to their organizations. One valid point is that senior managers are expected to make important decisions that can impact the company’s overall performance, which can be more stressful than the work requirements for ordinary employees. Therefore, organizations need to offer generous compensation to ensure that the directors feel motivated to meet the taxing demands of their high position. Another key reason is the enormous value that can be generated by qualified top executives, which outweighs their high compensation packages and promotes the company’s economic growth. Research indicates that qualified directors with good leadership skills hold 75% of the main factors that drive the success of their organizations, by giving innovative plans to significantly increase the sales figures. In conclusion, while some people argue that high director pay is unfair, I contend that individuals in managerial positions are entitled to earn excessive salaries for their contributions, particularly in terms of responsibilities for taxing demands and economic value for fostering the company’s growth. Directors of large organizations earn much higher salaries than ordinary employees do. Some people think it is necessary, but others are of the opinion that it is unfair. Discuss both views and give y... Xem thêm
0
4
Ngân
8/5/2025
Mong cô chấm writing task 1 giúp em ạ. Em xin cảm ơn cô nhiều ạ!
The graph below shows the number of overseas visitors who came to the UK for different purposes between 1989 and 2009 (in millions). Summarise the information by selecting and reporting the main features, and make comparisons where relevant. Answer: The graph illustrates the number of foreigners who visited the UK for different reasons from 1989 to 2009. Overall, all three categories experienced a rise throughout the given timeframe. Additionally, taking holiday trips was the most common purpose for UK visits, while meeting friends and relatives was the least common. A closer look at the graph reveals that in 1989, there were 5 million overseas visitors who came to the UK for business purposes, which was relatively higher than the number of those who came to meet friends and relatives, with a figure of 3.5 million. Subsequently, the former saw a slight drop to 4 million in 1992, before significantly rising to 8 million in 2008 and finally falling back to 7 million in 2009. Likewise, visitors who came to the UK for social reasons experienced a steady growth, increasing twofold to 7 million in 2008 and then receding to 6 million in the final year. On the other hand, there was a volatile pattern in the upward trend of holiday travel over the 20-year period. In the first year, the number of foreigners visiting the UK was 6.5 million, which remained the same within the next three years, before undergoing a surge to 9 million in 1996 and experiencing a sharp fall to around 6.5 million in 2004. However, the figure then increased steadily, recovering to its peak at 9 million by the end of the period. The graph below shows the number of overseas visitors who came to the UK for different purposes between 1989 and 2009 (in millions). Summarise the information by selecting and reporting the main fe... Xem thêm
0
5
Ngân
1/5/2025
Mong thầy cô chấm writing task 1 giúp em ạ. Em xin cảm ơn thầy cô nhiều ạ!
The line graph gives information about how Australian products were exported to four countries, including Japan, the US, China, and India, between 1990 and 2012. Overall, among the four countries, there was an increase in percentages of Australian exports to China and India, with the former becoming the leading export destination by the end of the period. In contrast, Japan and the US experienced a gradual decrease in the proportion of exports. A closer look at the graph reveals that in 1990, China and India started as the smallest export partners for Australian goods, with moderate figures of 2% and 1%, respectively. Thereafter, there has been a steady growth in the exporting percentage to China within a decade, before experiencing a surge up to fivefold in 2010 and continuing a slight increase to 27% in 2012. Likewise, India remained a marginal presence in Australia’s export market throughout a ten-year period, after which its share slightly moved upward to 7% in the next decade, before dropping to 5% in 2012. Regarding the remaining countries, Japan and the US first came as the largest export partners for Australian products, with impressive figures of 27% and 12%, respectively. However, Japan soon experienced a sharp decline to 17% in 2012, which made it the second-largest export destination by the end of the period. Similarly, the US saw an insignificant decrease in the first five years, then had a steady growth until 2000, before bottoming out to only 5% in 2010 and rising to 7% in the final year. The line graph gives information about how Australian products were exported to four countries, including Japan, the US, China, and India, between 1990 and 2012. Overall, among the four countries,... Xem thêm
0
5
bùi quỳnh chi
2/5/2025
Children who grow up in a family with less money are more capable of dealing with prolems in adult life than children who are brought up by wealthy parents. To what extent do you agree or disagree?
Kids who are come from impoverished family have the ability to solve problems compared to those are raised by affluent family. However, I completely disagree with this viewpoint due to numerous reasons that will be explained in this essay. Growing up in a low-income family, where children are not be able to gain enough knowledge and experience on problem solving. As their financial background, they are in a weak position to get access to a beneficial educational environment such as prestigiuos schools, where provide them with essential skills and knowledges. As a result, without the understanding of extensive knowledge, students may have difficulty with dealing issues. Another reason is that they do not allocate enough time to study and not concentrate on acquiring more personal involvement and comperhension. While learning is a long-lasting journey that require a lot of efforts and endeavor, children with low-social economic background may have to help parent’s housework and even dropping out of school to earn their livelihood, thus disrupting their learning process. Financial support and expert guidance are not offer to children because of their background. With wealthy family, it is believed that they have sufficient income to deal with problems, which a challenges for kids who are in a poor family. In this day and age, financial plays a crucial role in most aspects of life, following with attempts, so children with financial problems are always defeated by these difficulties. Rich children have a lot of opportunities to enroll in social gathering and having meal with well-know experts in various fields, allowing students to expand relationships and can easily deal with their problems. In contrast, without relationships with experts and influencers, thus a lack of understanding and priority to overome difficulties. In conclusion, children from high-class families normally have the upper hand over ones in both knowledge and finance, which plays a vital role in improvign their problem-solving abilities. Kids who are come from impoverished family have the ability to solve problems compared to those are raised by affluent family. However, I completely disagree with this viewpoint due to numerous reason... Xem thêm
0
3